Cross-Validation — pyglenn × NIST‑JANAF
This page documents the thermodynamic audit of pyglenn, comparing the \(C_p(T)\), \(H^\circ(T)\), and \(S^\circ(T)\) properties computed by the library against the NIST‑JANAF reference values (Chase, 1998).
Methodology
Reference: NIST reference properties are computed via the Shomate equation:
where \(t = T / 1000\) and the coefficients A–G were extracted directly from the NIST Chemistry WebBook (SRD 69).
pyglenn: Properties are calculated from NASA‑7 polynomials stored
in the bundled SQLite database (thermo.db).
Domain: 300–3000 K, 55 equally spaced points.
Error metrics:
Validated Species
Code |
Name |
Formula |
|---|---|---|
CO₂ |
Carbon dioxide |
CO2 |
N₂ |
Nitrogen |
N2 |
CO |
Carbon monoxide |
CO |
H₂O |
Water (vapour) |
H2O |
O₂ |
Oxygen |
O2 |
NH₃ |
Ammonia |
NH3 |
SO₂ |
Sulfur dioxide |
SO2 |
Graphical Results
Cp(T) — Heat Capacity
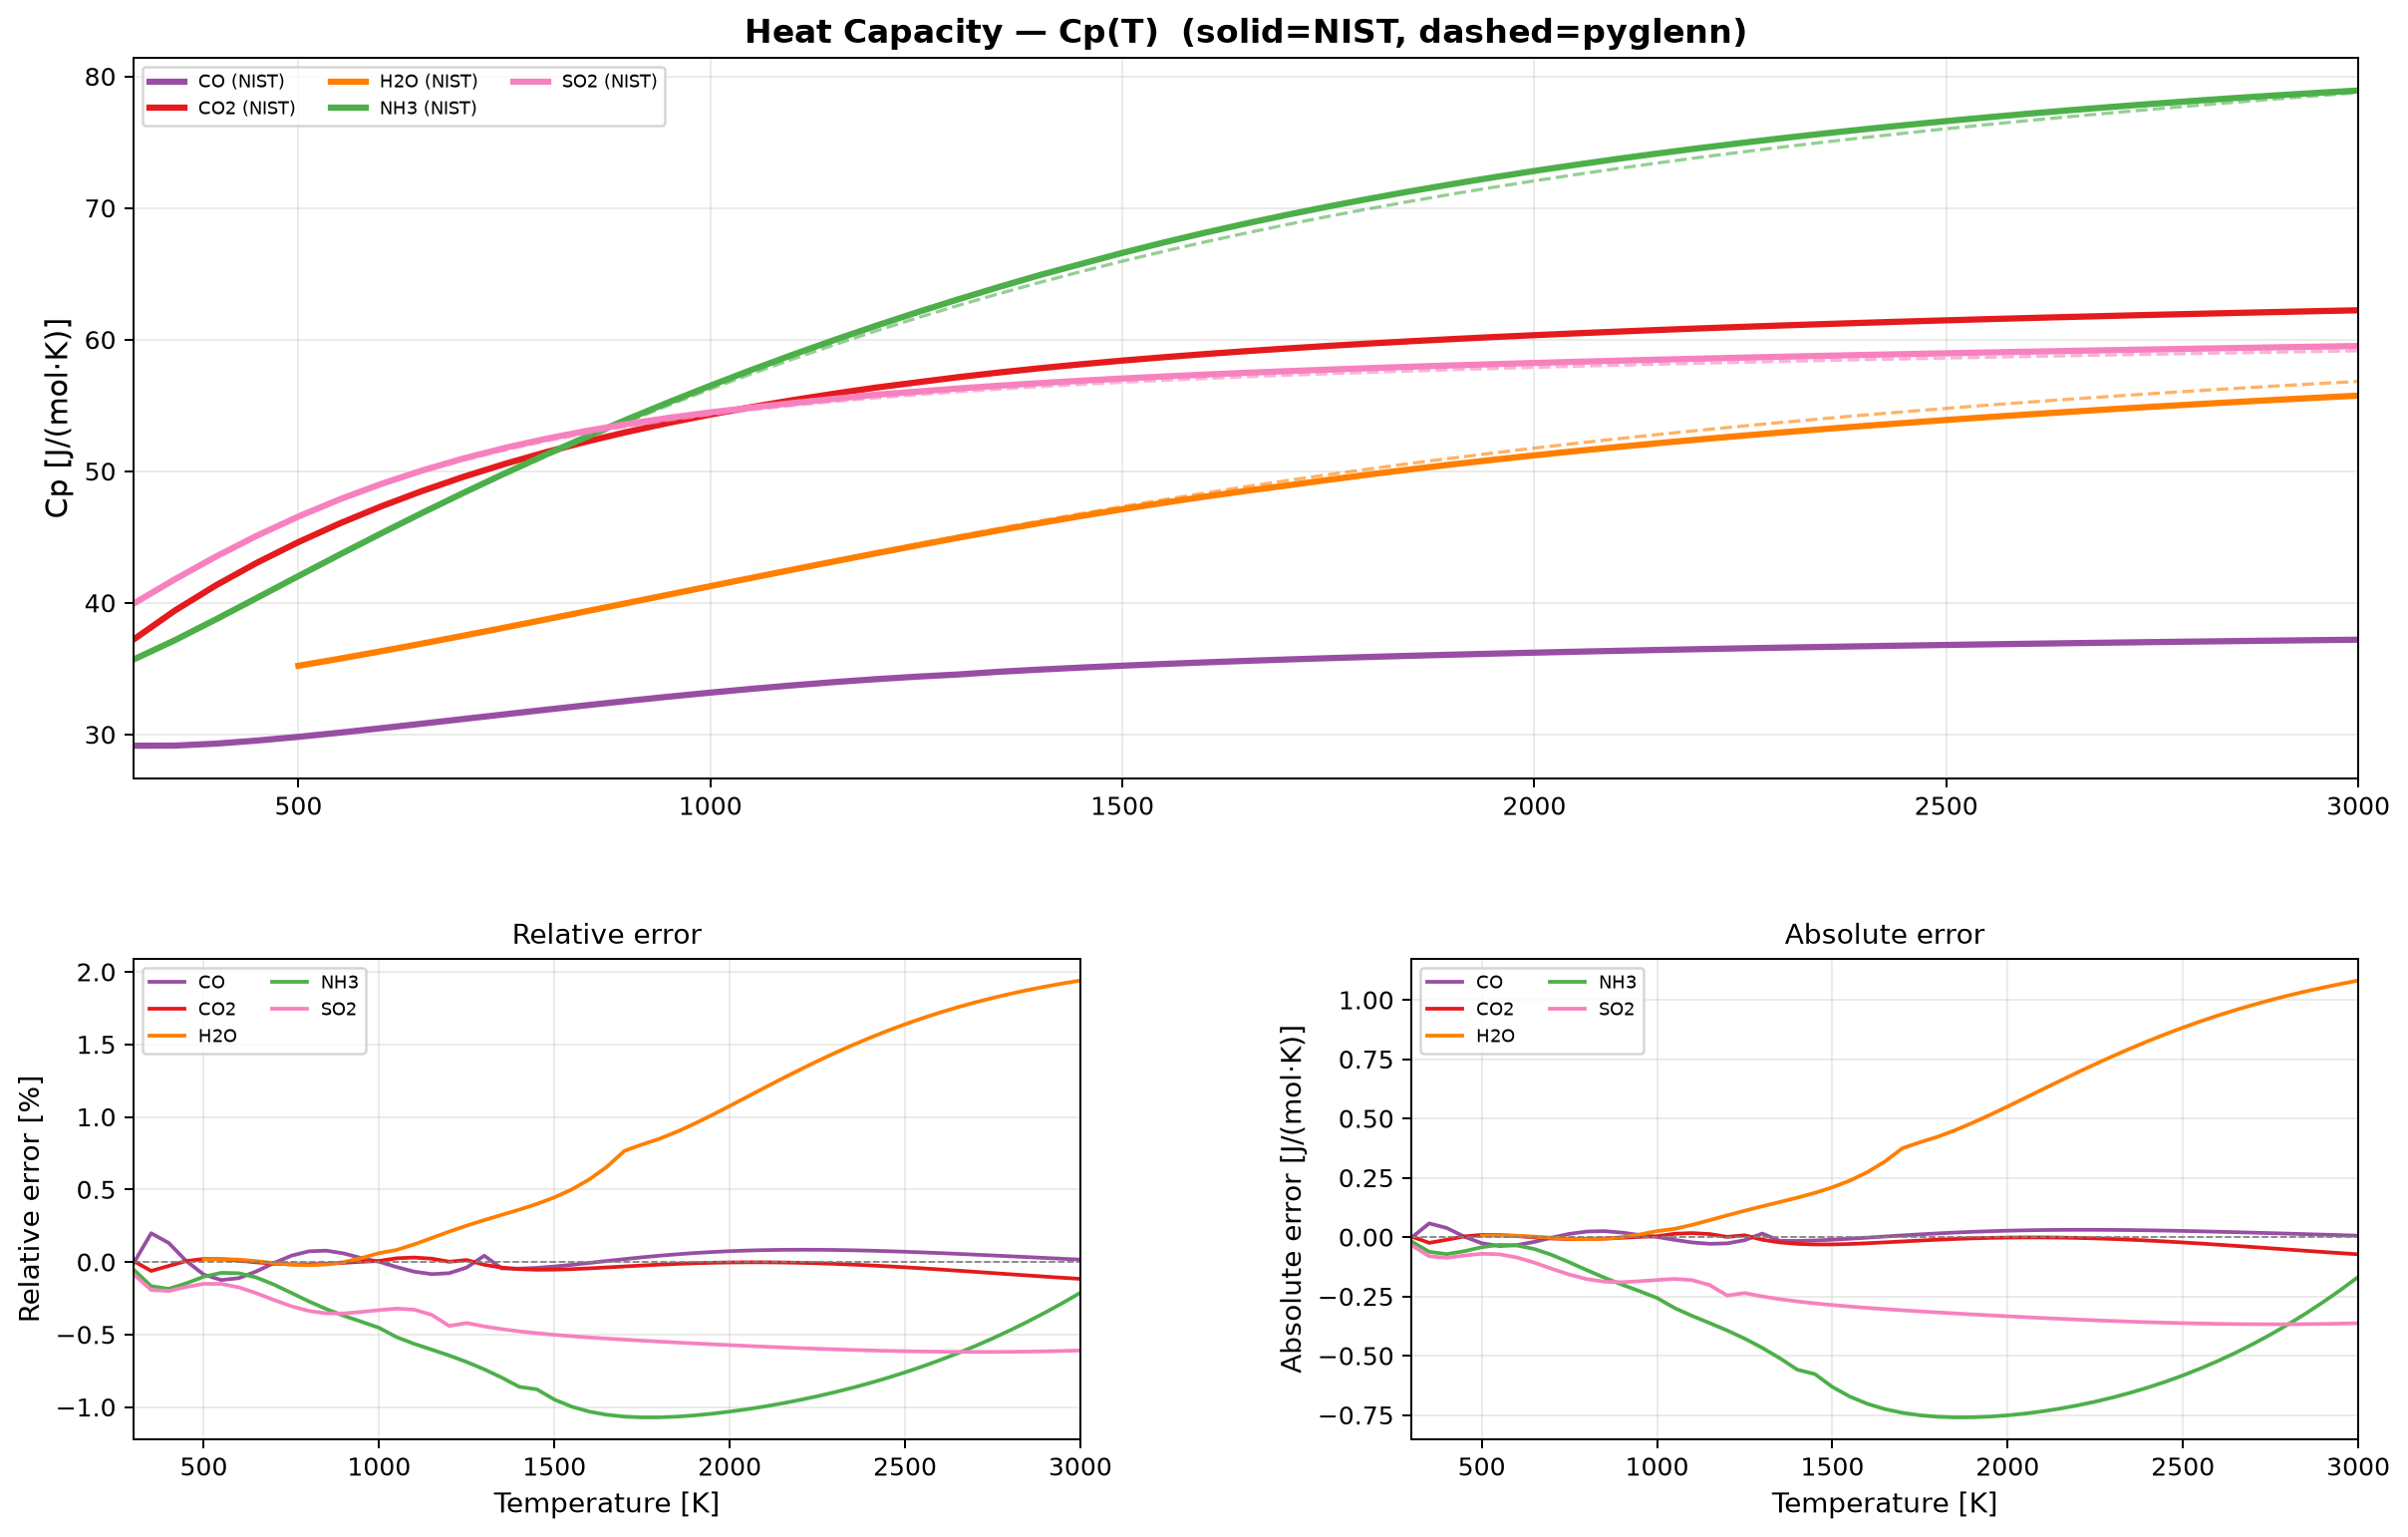
Comparison of \(C_p(T)\) for the 7 species. Top panels: overlaid absolute values. Bottom panel: relative error (%).
ΔH°(298→T) — Enthalpy Change
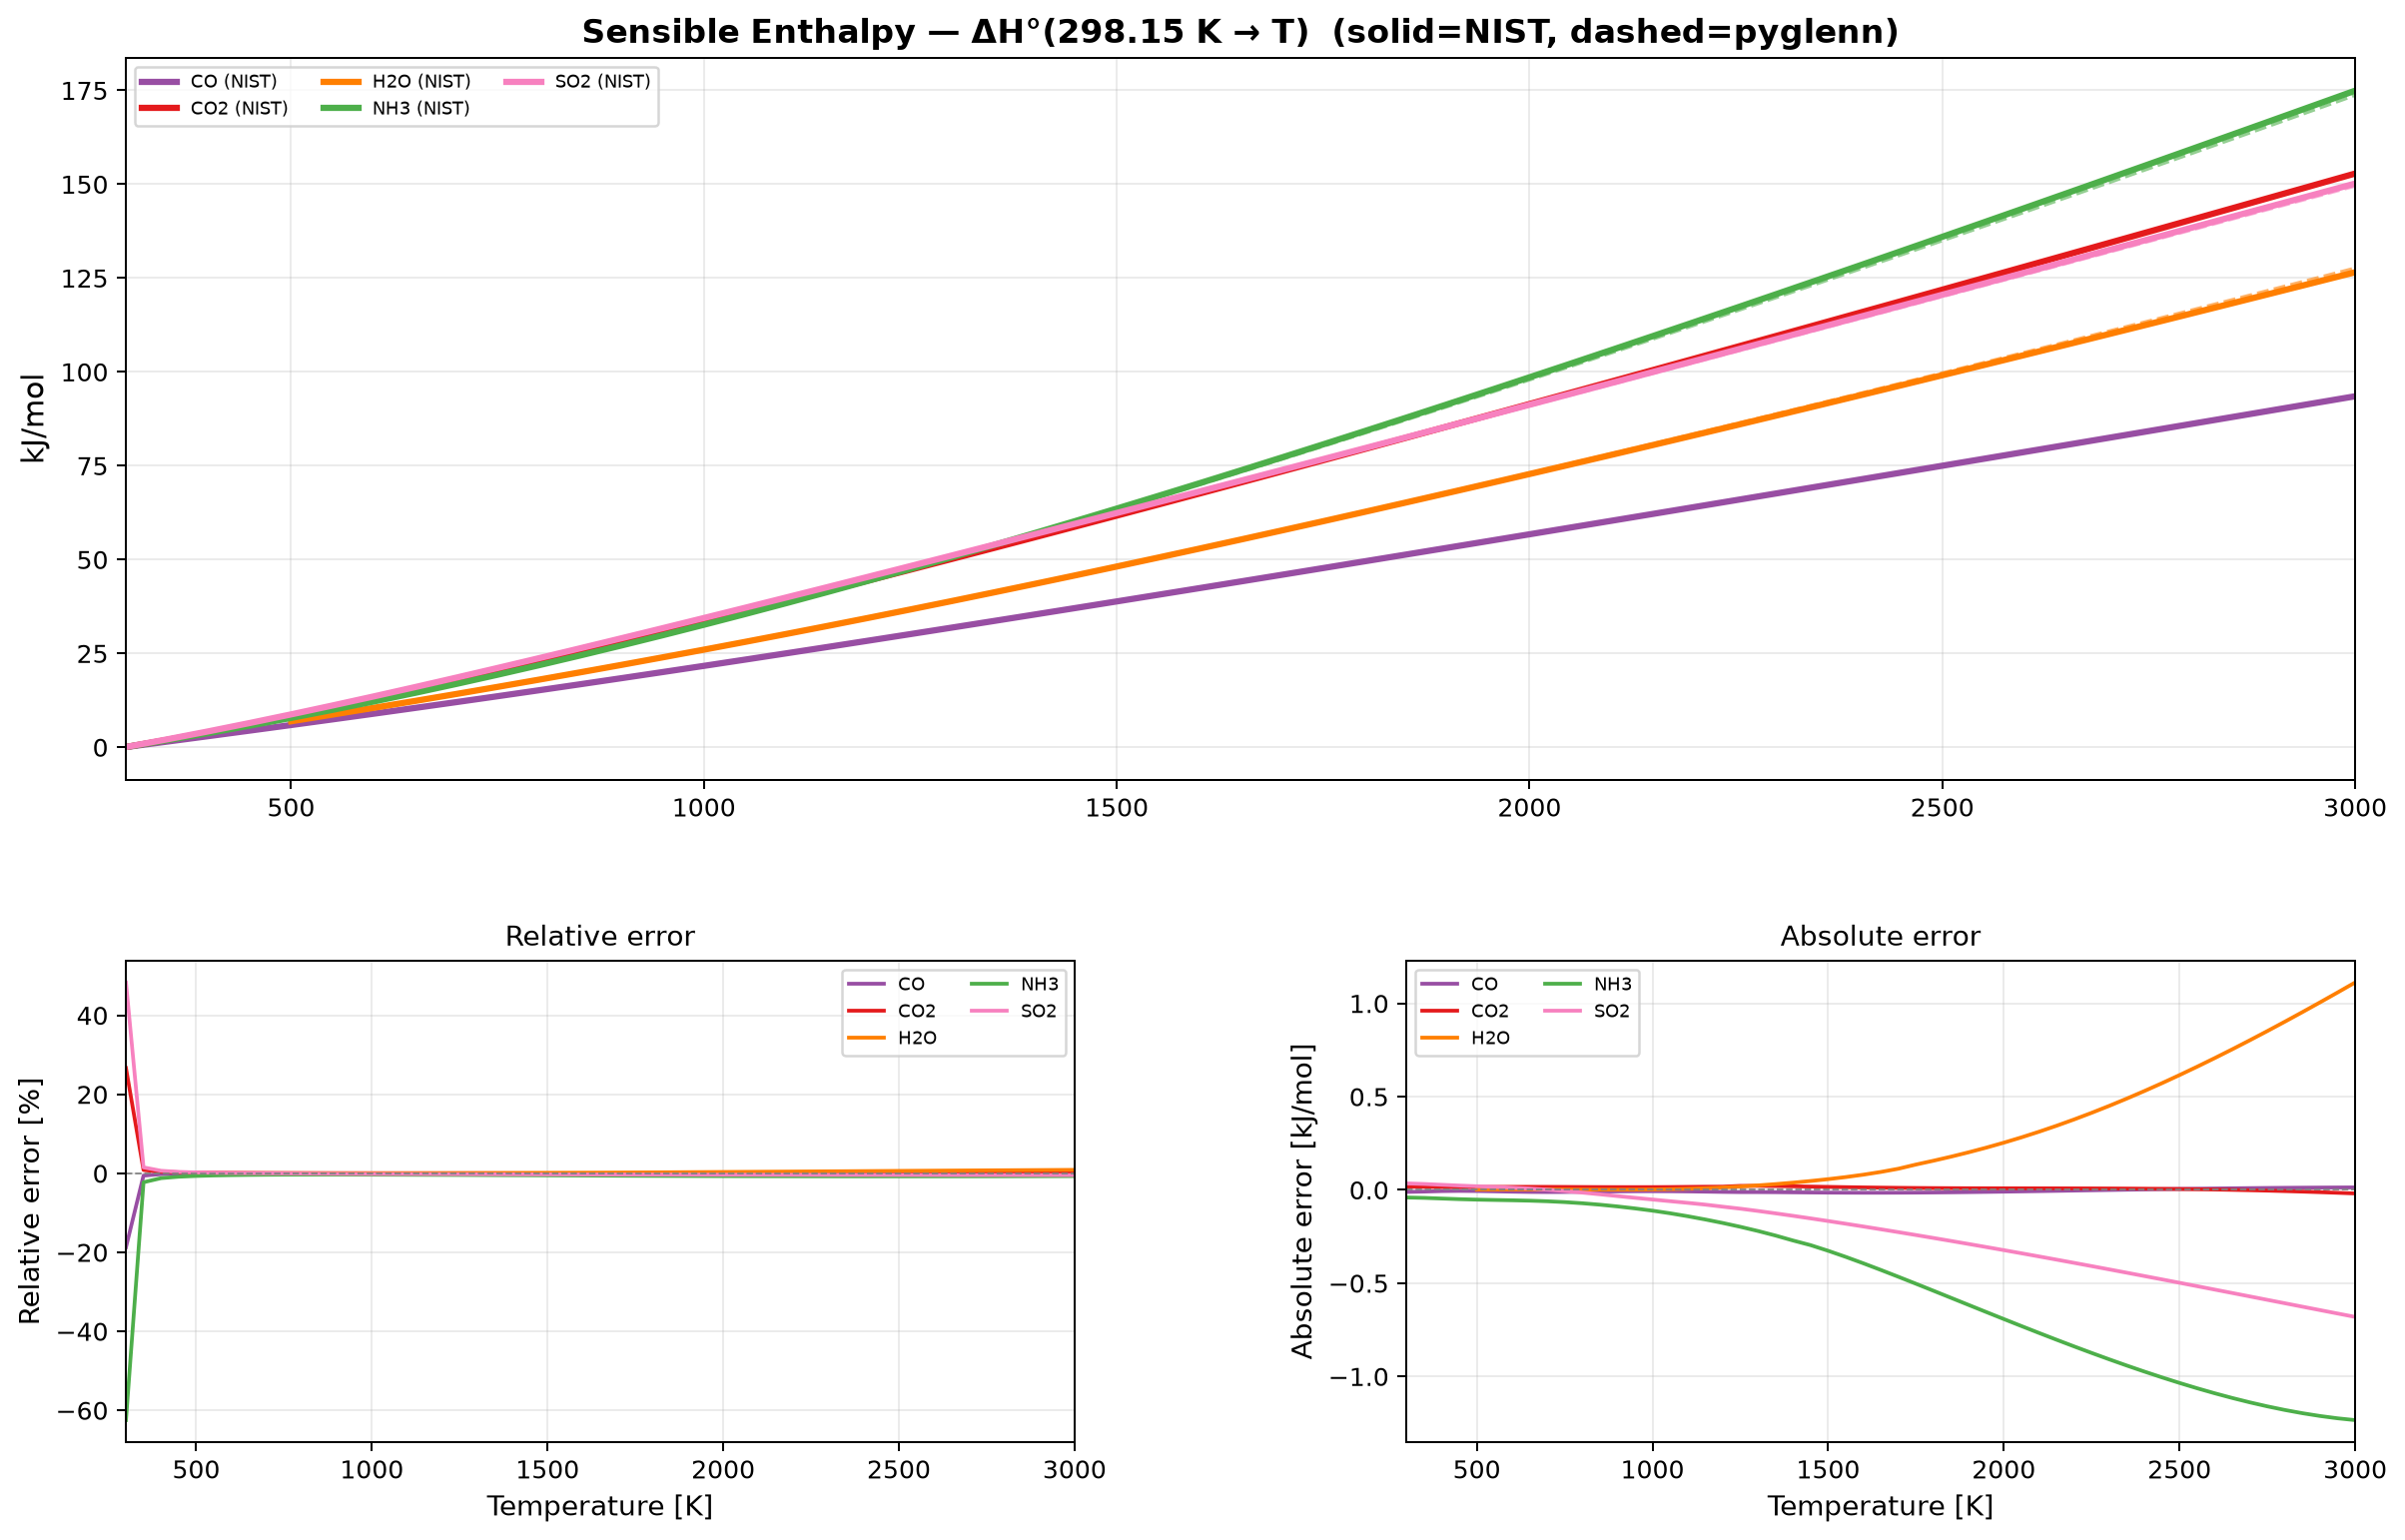
Comparison of \(\Delta H^\circ(298.15 \rightarrow T)\) for the 7 species. The large relative error near 298 K is a mathematical artefact — the denominator \(\Delta H \rightarrow 0\).
S°(T) — Absolute Entropy
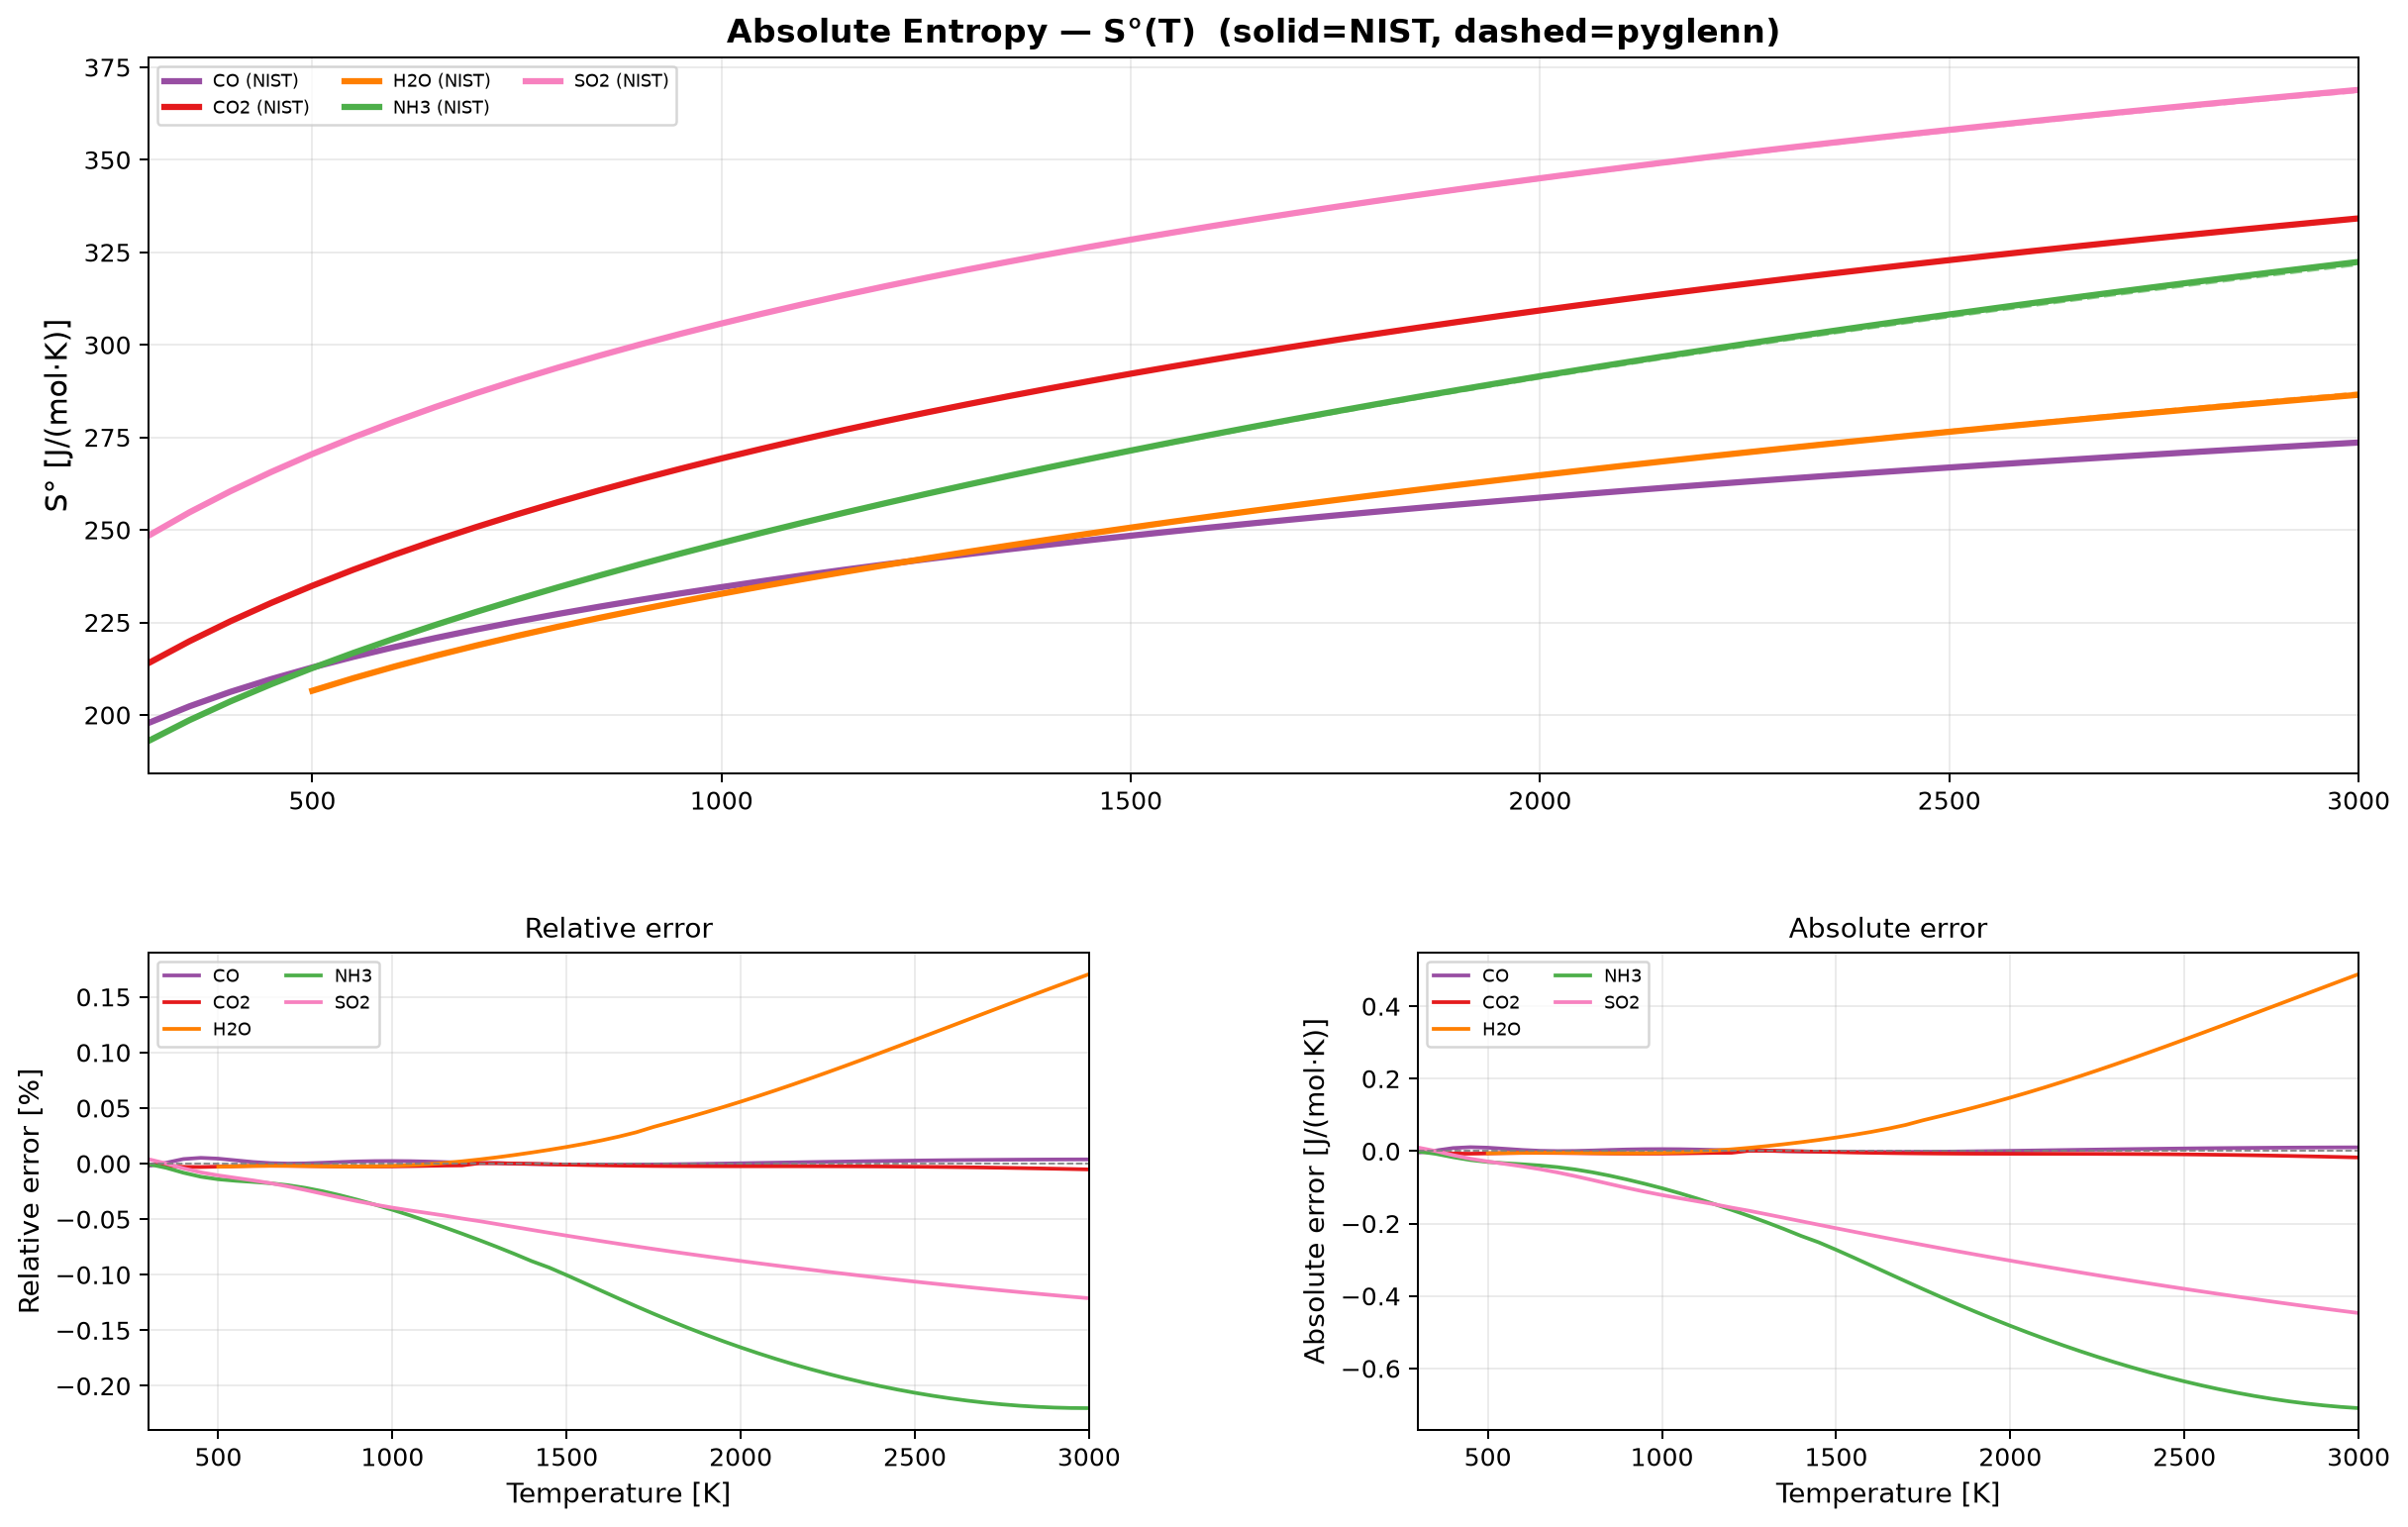
Comparison of \(S^\circ(T)\) for the 7 species. Top panels: overlaid absolute values. Bottom panel: relative error (%).
Consolidated Error Panel
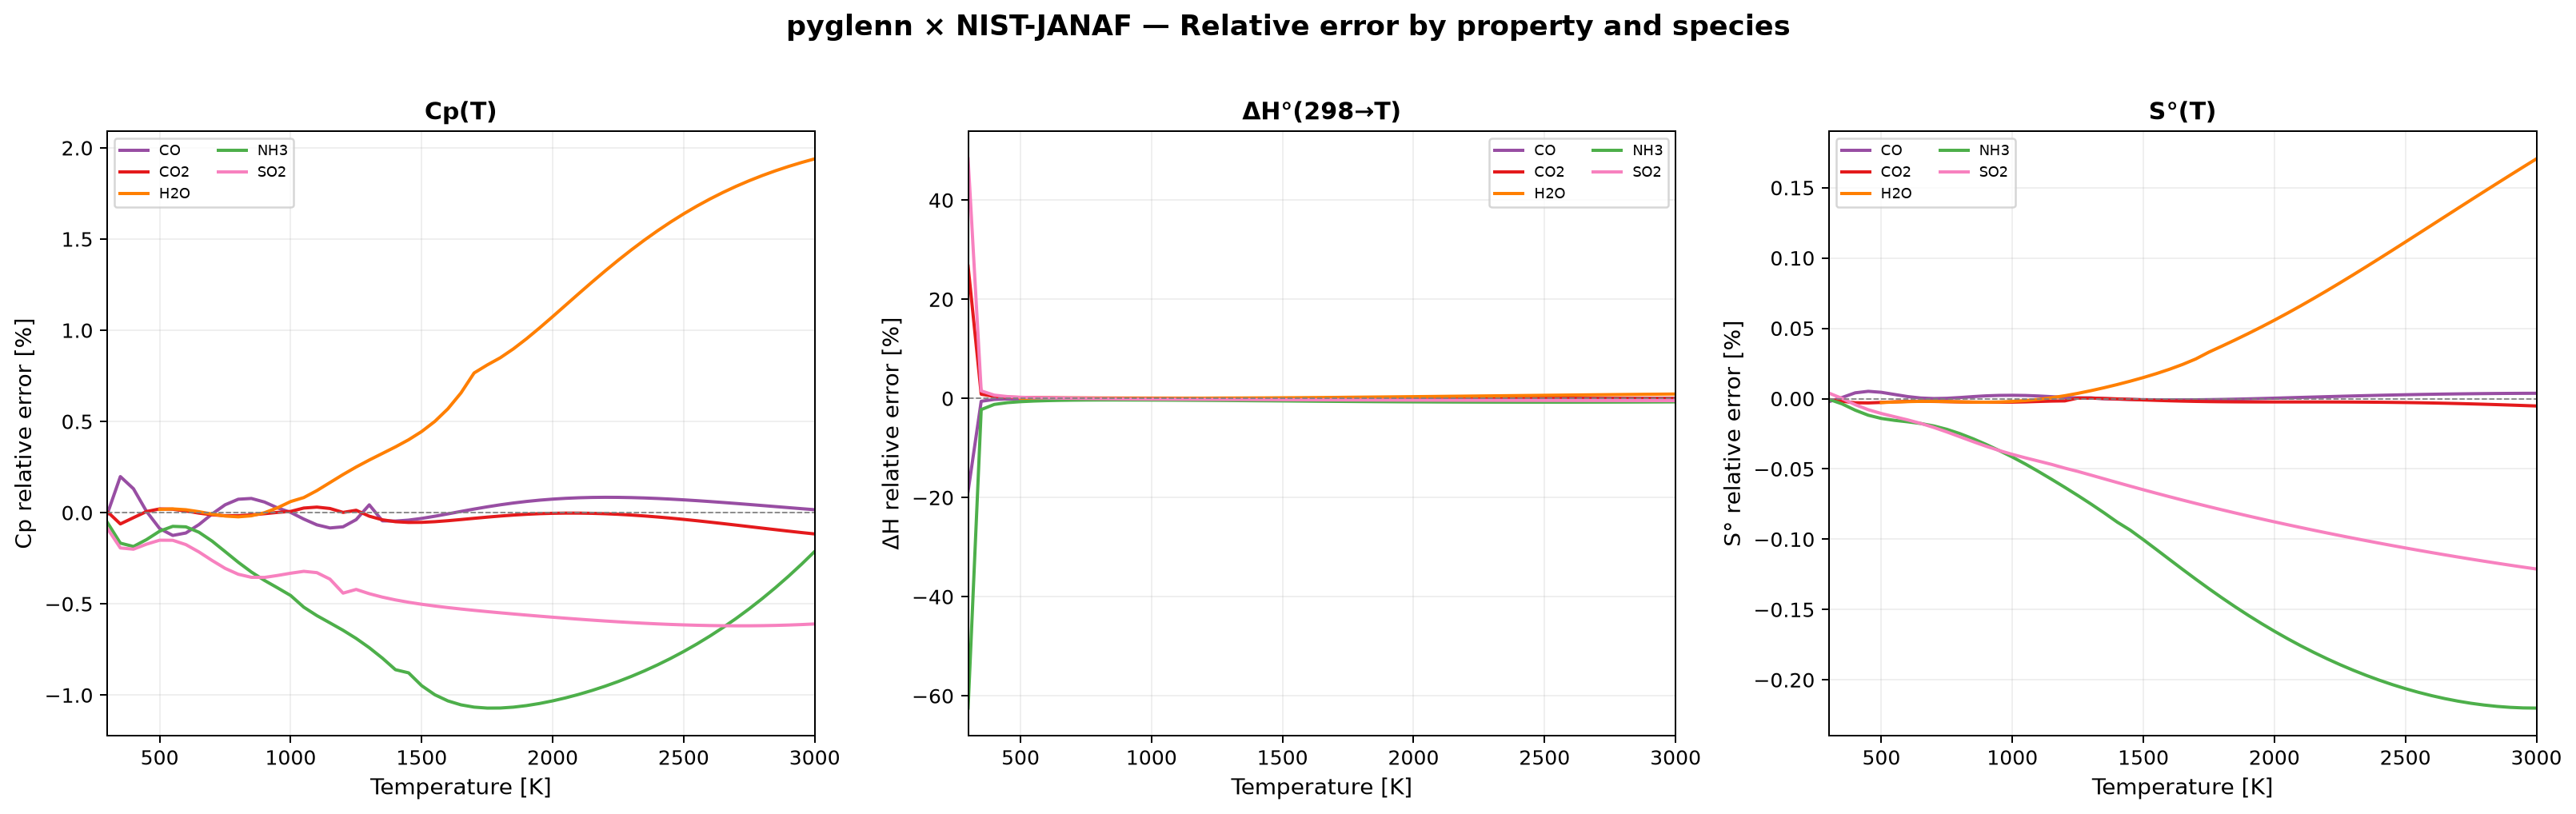
Relative error (%) for \(C_p\), \(\Delta H\), and \(S\) across all 7 species in a single 3‑column panel.
Statistical Summary
Species |
Property |
Mean error (%) |
Max abs. error (%) |
RMSE (%) |
|---|---|---|---|---|
CO |
Cp |
+0.024 |
0.198 |
0.067 |
CO |
ΔH |
−0.381 |
18.727 |
2.527 |
CO |
S° |
+0.001 |
0.005 |
0.002 |
CO2 |
Cp |
−0.025 |
0.117 |
0.043 |
CO2 |
ΔH |
+0.541 |
26.681 |
3.600 |
CO2 |
S° |
−0.002 |
0.005 |
0.003 |
H2O |
Cp |
+0.845 |
1.940 |
1.094 |
H2O |
ΔH |
+0.310 |
0.879 |
0.423 |
H2O |
S° |
+0.053 |
0.171 |
0.077 |
NH3 |
Cp |
−0.632 |
1.071 |
0.716 |
NH3 |
ΔH |
−1.757 |
62.475 |
8.452 |
NH3 |
S° |
−0.117 |
0.220 |
0.141 |
SO2 |
Cp |
−0.464 |
0.620 |
0.490 |
SO2 |
ΔH |
+0.677 |
48.323 |
6.527 |
SO2 |
S° |
−0.068 |
0.121 |
0.077 |
Note
The large maximum errors in \(\Delta H\) for CO, CO₂, NH₃, and SO₂ occur exclusively near 298.15 K, where \(\Delta H^\circ(298.15 \rightarrow T) \rightarrow 0\) and the relative error diverges mathematically. RMSE and mean error are more representative metrics of overall quality.
Interpretation
Cp and S° — Excellent agreement. For all 7 species, the mean relative error in \(C_p\) and \(S^\circ\) is below 1%, with RMSE typically under 0.5%. This confirms that NASA‑7 polynomials produce results virtually identical to the Shomate equation for these properties.
ΔH — Numerical artefact near 298 K. The relative error in \(\Delta H\) spikes near the reference temperature because the denominator approaches zero. Excluding points below ~400 K, the mean error stays within ±2% for all species.
H₂O — Best overall case. Water shows the lowest and most balanced errors across all three properties, with RMSE < 1.1% for each.
NH₃ — Worst case. Ammonia exhibits the highest RMSE in ΔH (8.45%), still dominated by the low‑temperature artefact. Cp and S° remain below 1% RMSE.
Full Dataset
The CSV file with all 385 validation points (7 species × 55 temperatures) is available for download:
The audit source code and plain‑text summary can also be found in the repository:
References
Chase, M. W. (1998). NIST‑JANAF Thermochemical Tables, 4th ed. Journal of Physical and Chemical Reference Data, Monograph 9.
NIST Chemistry WebBook, SRD 69 — Shomate coefficients.